P300 Experiment
P300 signals are brain signals that occur in response to visual stimuli. They usually appear approximately 300 ms after the stimulus is presented.
This example shows how to use Mentalab Explore with an oddball experiment to elicit P300 signals. The code is open-source and available here:
You can run the example as provided or use it as a basis for your own P300-based applications.
In this experiment, the oddball task uses two visual stimuli: a blue rectangle and a red oval. The red oval is the "oddball". The participant must press space whenever the red stimulus appears.
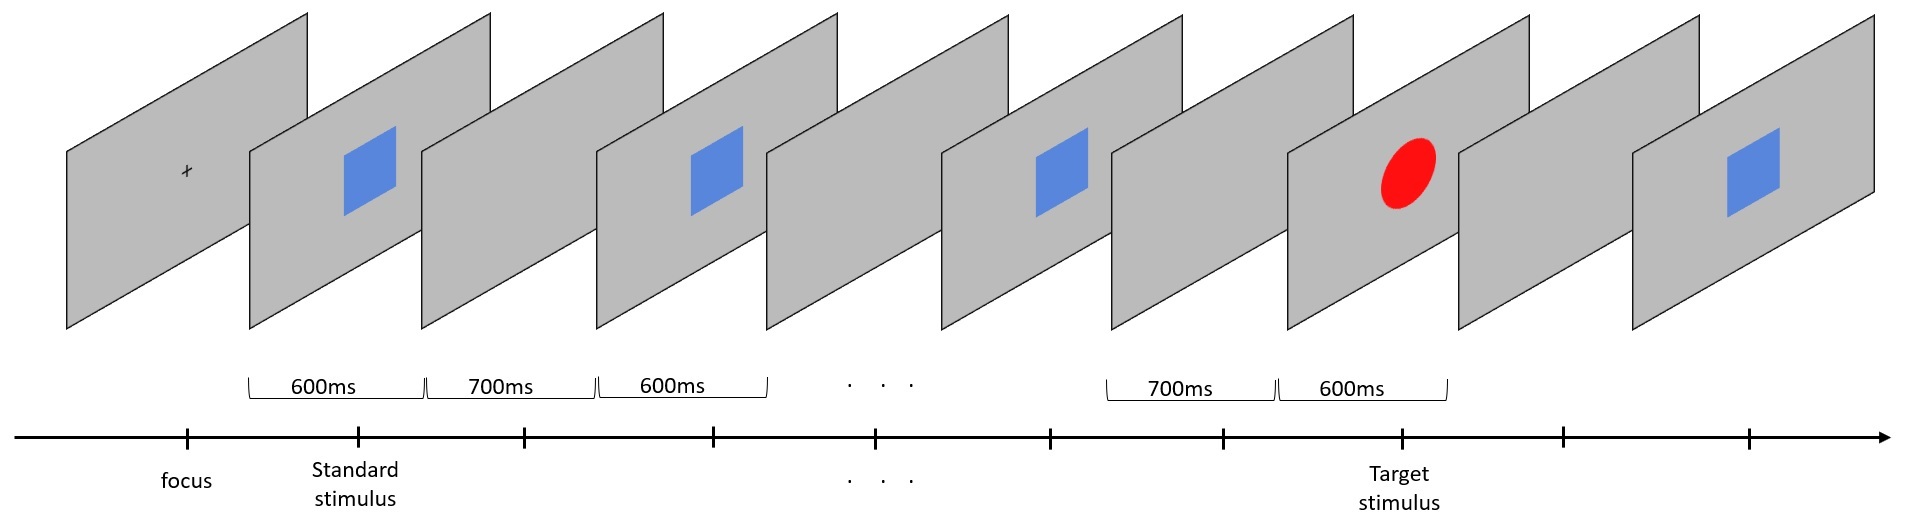
A blue rectangle is the standard stimulus. The red oval is the "oddball". When presented with the oddball, participants must press space.
Preparation
Software
-
Install
explorepy.Choose Option 2 (Python) if you are installing
explorepyon a Windows system. -
Download the
explorepycode directly from GitHub:To do this, click on the green Code button and then Download ZIP.
Remember where you extract the files. You will need this location later.
-
Activate your Anaconda virtual environment:
conda activate myenv -
Install the required packages:
pip install scikit-learn matplotlib psychopy mne -
In the Conda terminal, navigate to the
p300_demofolder in theexamplesdirectory ofexplorepy.
P300 Experiment
-
Turn on the device and ensure it is advertising.
-
Run the following command in your terminal.
Replace
##with your device ID, for exampleExplore_1438:python experiment.py -n Explore_#### -f rec_file_name
The experiment has 10 blocks and 5 trials in each block, resulting in 50 trials in total.
You can change this in the experiment.py script by editing the variables n_blocks and n_trials_per_block.
The experiment produces three .csv files in the working directory: one for ExG data, one for motion data, and one for markers.
Results
-
To analyse the recorded data and generate plots, run the following command in your terminal:
python analysis_csv.py -f rec_file_name
This analysis generates P300 waveform plots similar to the example shown below.
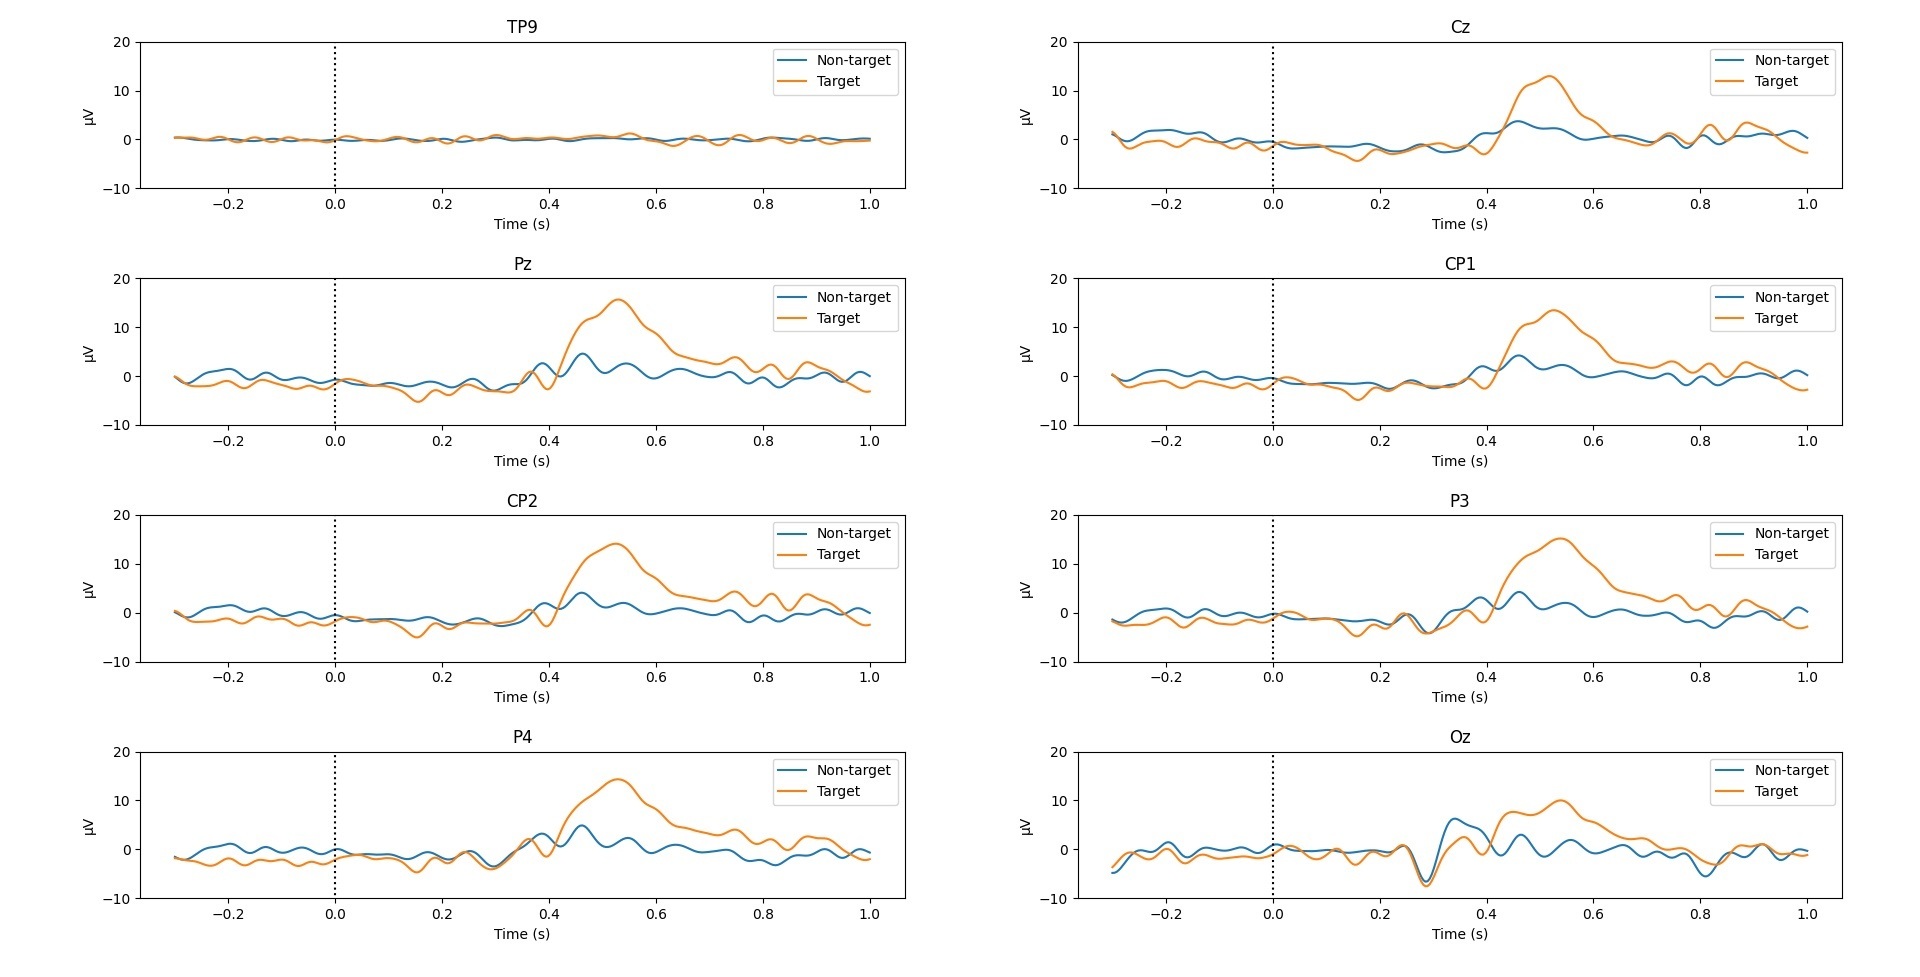
Waveforms produced from the P300 oddball experiment using the Mentalab Explore device and explorepy.
For more information or support, contact support@mentalab.com.