FieldTrip
This document provides a simple guide for loading Mentalab Explore device recordings into FieldTrip for ExG analysis and visualization.
Prerequisites
Before using this guide, you need:
- A Mentalab Explore device
- ExplorePy installed and configured
- MATLAB with FieldTrip toolbox installed
Step 1: Recording Data with Mentalab
Record your EEG data using ExplorePy CLI, Explore Desktop, or Explore Mobile.
Step 2: Setting Up FieldTrip
- Download FieldTrip from fieldtriptoolbox.org
- Add FieldTrip to your MATLAB path:
% Add FieldTrip to your MATLAB path
addpath('/path/to/fieldtrip');  % Replace with your FieldTrip path
ft_defaults;  % Initialize FieldTrip
Step 3: Prepare Your Data Files
After recording, you should have these files in your working directory:
my_recording_ExG.csv- EEG datamy_recording_Meta.csv- Recording metadatamy_recording_Marker.csv- Event markers
In order to load ExG data to FieldTrip we will use *_ExG.csv and *_Meta.csv files.
Step 4: Loading and Visualizing Data
Using the Provided MATLAB Script
Run the script:
% --- CSV FILE LOADING ---
% Prompt user for CSV file name
filename = input('Enter CSV filename: ', 's');
% Prompt user for metadata file name
meta_filename = input('Enter metadata filename: ', 's');
% Prompt user for marker file name
marker_filename = input('Enter marker filename: ', 's');
% Load CSV
csv_data = readmatrix(filename);
time = csv_data(:,1);
eeg = csv_data(:,2:end);
% Load meta data and get sampling rate
meta_data = readtable(meta_filename);
sampling_rate = meta_data.sr(1);
% Load marker file
marker_table = readtable(marker_filename);
% Convert marker timestamps to sample indices
marker_samples = round((marker_table.Timestamp - time(1)) * sampling_rate) + 1;
% Build event structure
events = struct('type', {}, 'sample', {}, 'value', {}, 'duration', {}, 'offset', {});
for i = 1:height(marker_table)
events(i).type = 'trigger';
events(i).sample = marker_samples(i);
events(i).value = marker_table.Code(i);
events(i).duration = 0;
events(i).offset = 0;
end
% Build FieldTrip data structure
data_csv = [];
data_csv.fsample = sampling_rate;
data_csv.time = {time' - time(1)};
data_csv.trial = {eeg'};
data_csv.label = arrayfun(@(x) sprintf('ch%d', x), 1:size(eeg,2), 'UniformOutput', false);
% Add events to FieldTrip data structure
data_csv.cfg = [];
data_csv.cfg.event = events;
fprintf('Sampling rate (fsample): %.2f Hz\n', data_csv.fsample);
% --- APPLY FILTERS ---
% 1. Bandpass filter (0.5-35 Hz)
cfg_bp = [];
cfg_bp.bpfilter = 'yes';
cfg_bp.bpfreq = [0.5 35];
cfg_bp.bpfiltertype = 'but';
cfg_bp.bpfiltord = 4;
cfg_bp.bpfiltdir = 'twopass';
data_filtered = ft_preprocessing(cfg_bp, data_csv);
% 2. Notch filter (50 Hz)
cfg_notch = [];
cfg_notch.bsfilter = 'yes';
cfg_notch.bsfreq = [49 51];
cfg_notch.bsfiltertype = 'but';
cfg_notch.bsfiltord = 4;
cfg_notch.bsfiltdir = 'twopass';
data_filtered = ft_preprocessing(cfg_notch, data_filtered);
fprintf('Applied filters: 0.5-35 Hz bandpass and 50 Hz notch\n');
% Visualize filtered data
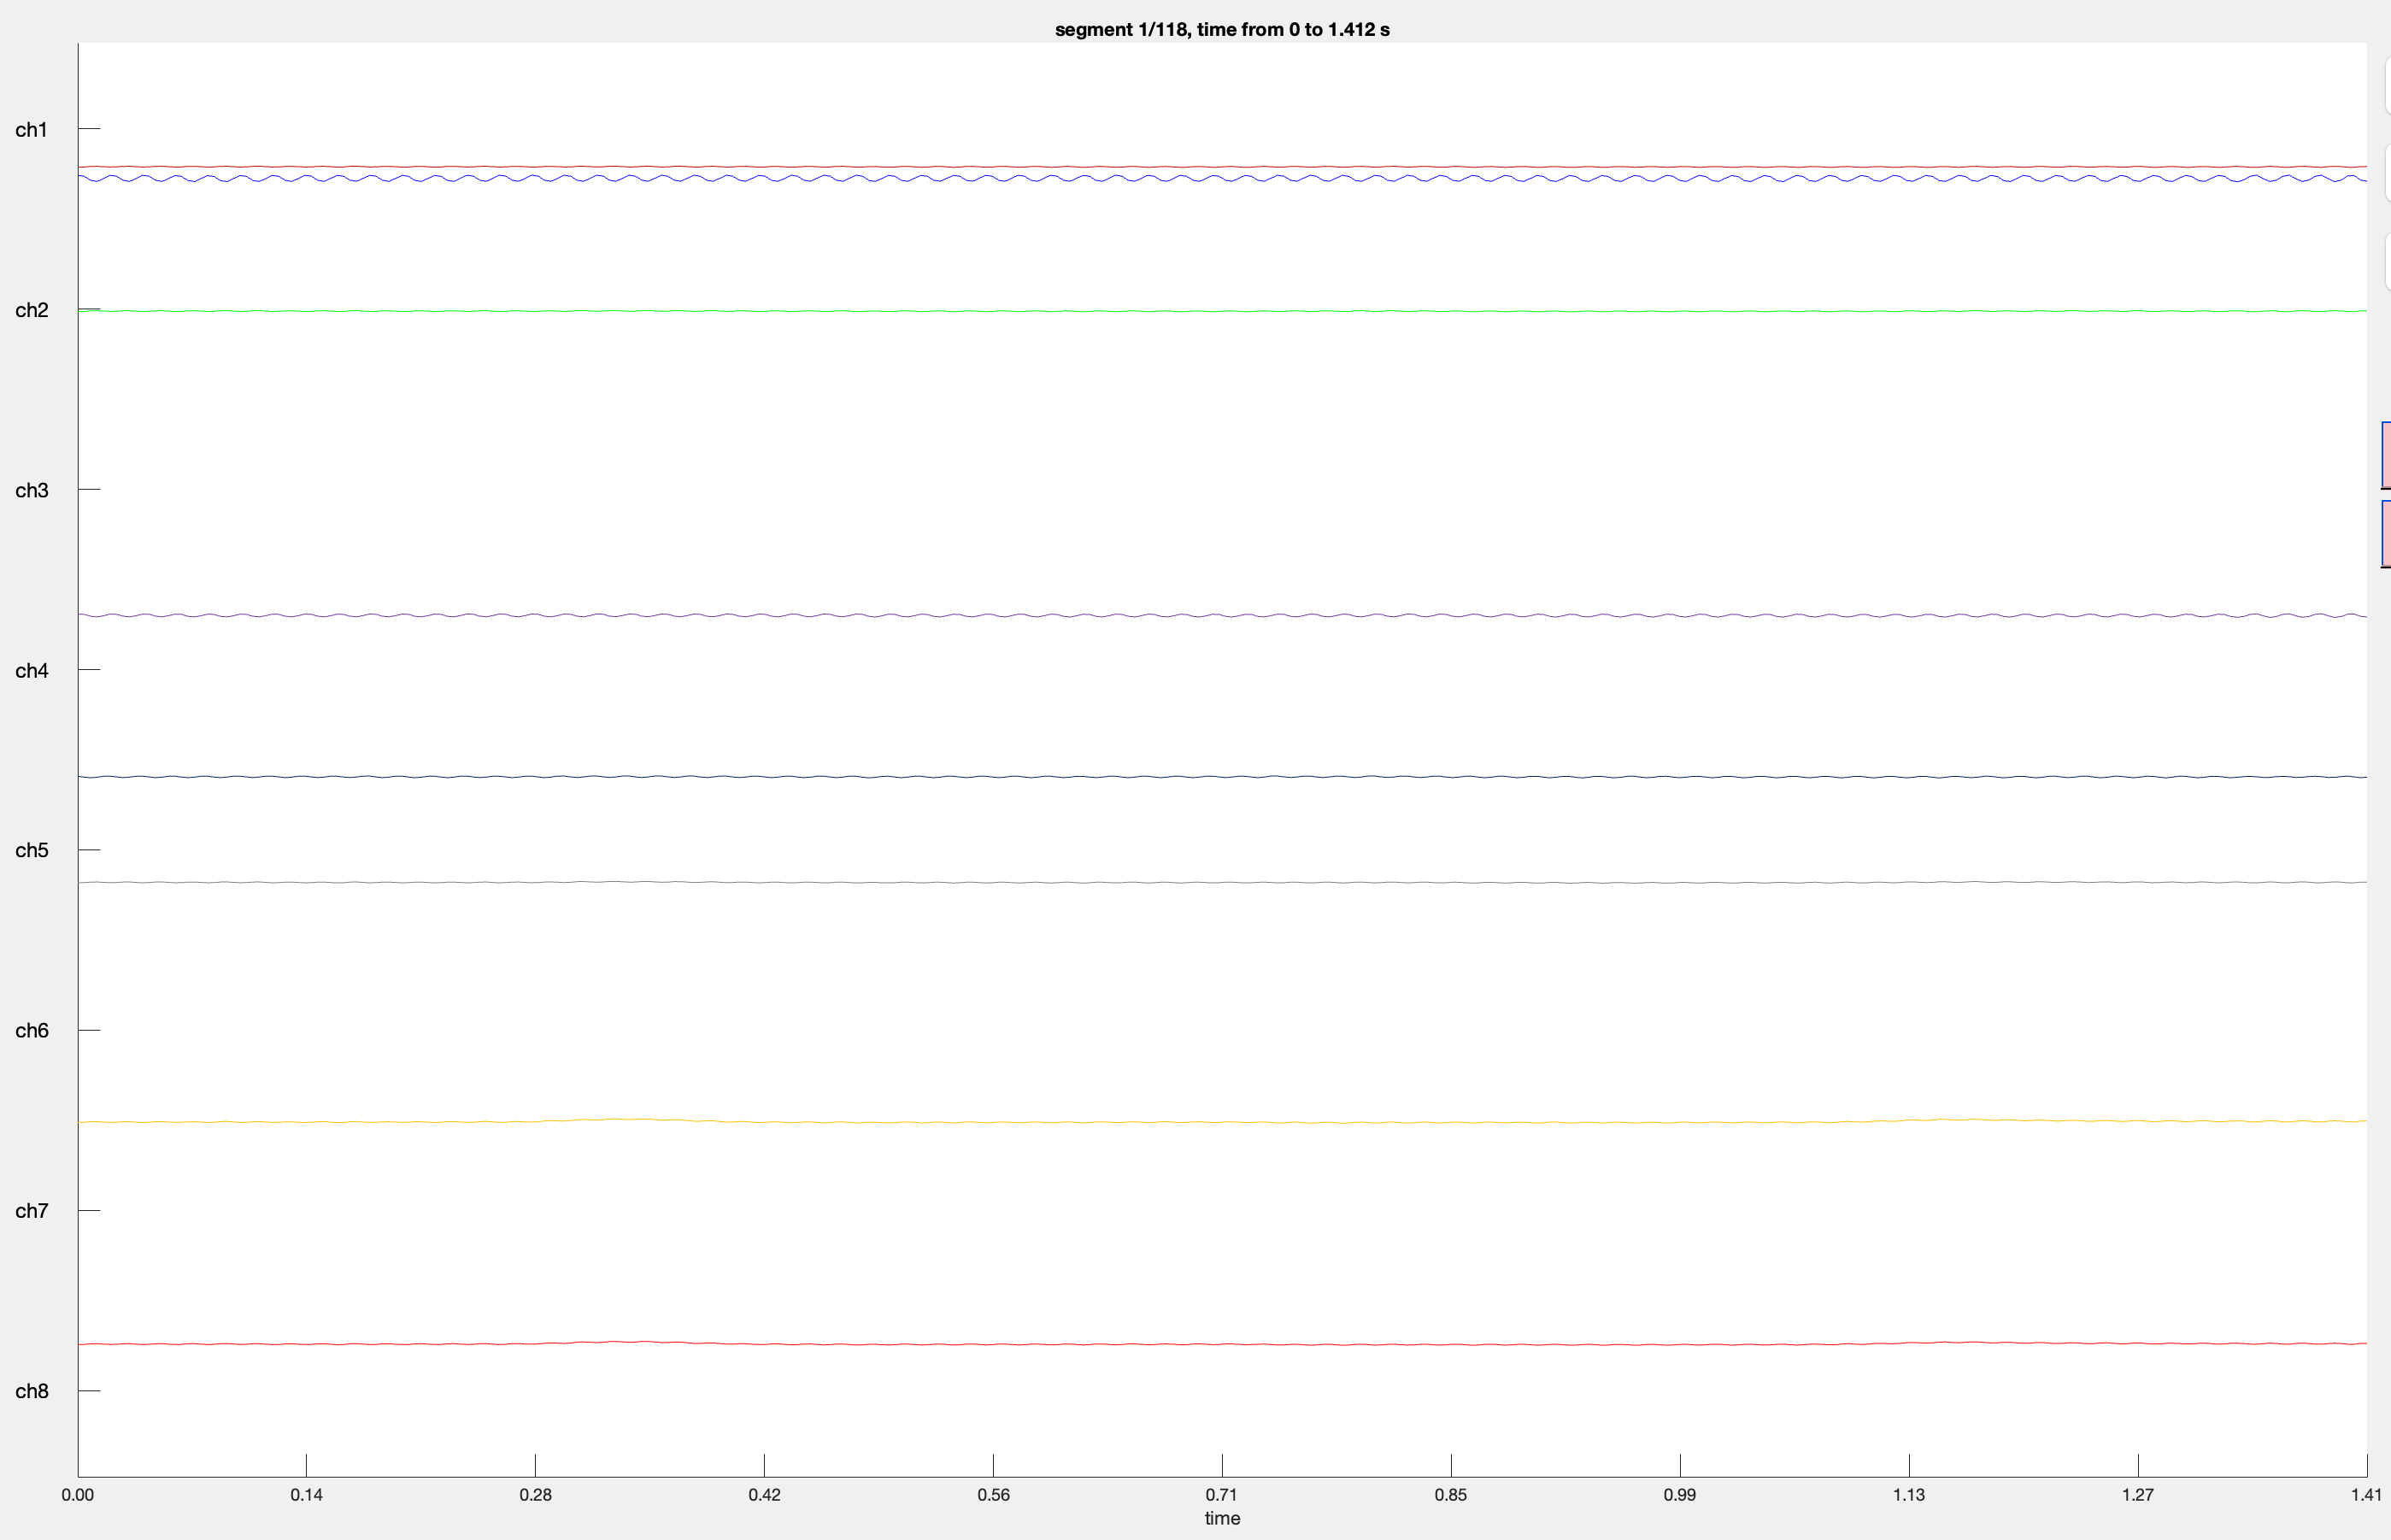
cfg = [];
cfg.viewmode = 'vertical';
ft_databrowser(cfg, data_filtered);
- Run the script
- When prompted, enter your ExG CSV filename (e.g., ‘my_recording_ExG.csv’)
- When prompted, enter your Meta CSV filename (e.g., ‘my_recording_Meta.csv’)
- When prompted, enter your Marker CSV filename (e.g., ‘my_recording_Marker.csv’)
The script will:
- Load the CSV data
- Create a FieldTrip-compatible data structure
- Apply preprocessing filters:
- Bandpass filter (0.5-35 Hz)
- Notch filter (50 Hz)
- Display the filtered data using
ft_databrowser