Explore Signals Guide
Offline ExG Data Visualization with ExploreSignals
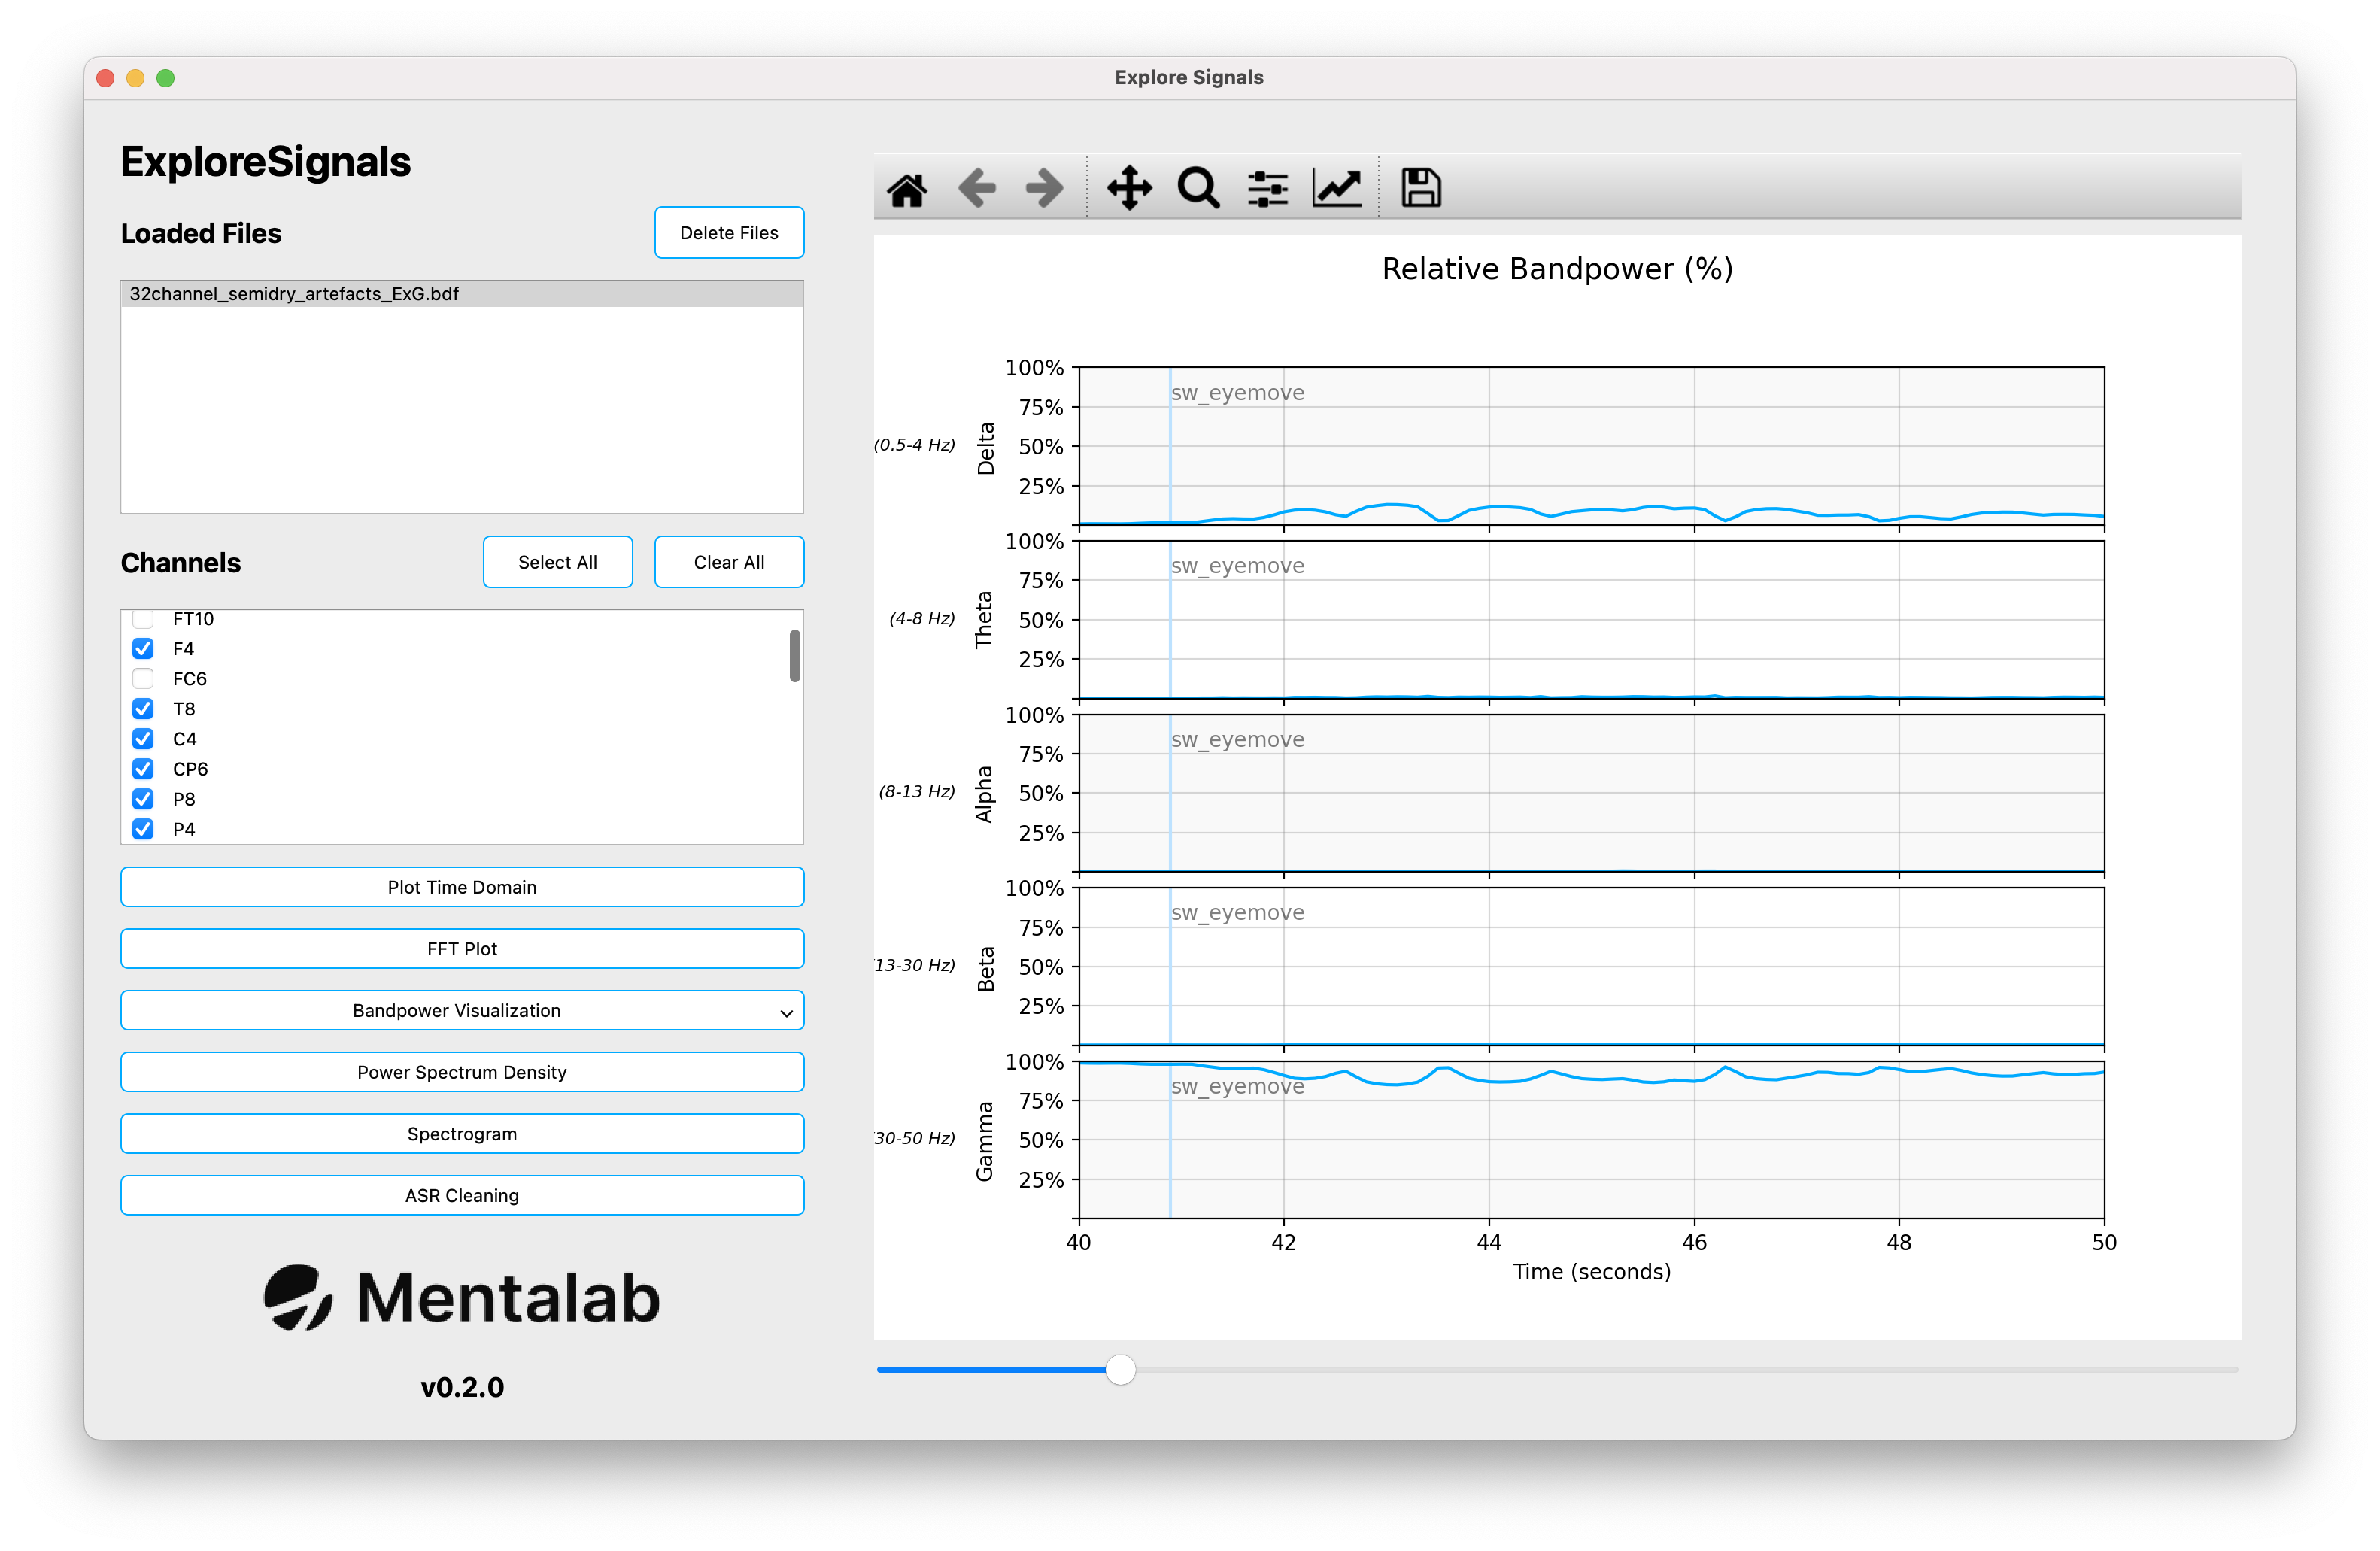
Explore Signals is a graphical tool for ExG data visualization and analysis. It supports importing data from Mentalab Explore devices from .csv and .bdf files, visualizing signals in time and frequency domains, applying common filters, applying ASR and exporting the processed data. It also offers conversion of binary recordings from Explore devices, repairing of .csv recordings from ExploreDesktop and conversion of recordings to EEGLab datasets.
Key Features
- Load EEG/ExG data from
.csvand.bdffiles - Apply standard EEG filters:
- High-pass / Low-pass
- Notch filter
- Re-referencing
- DC offset correction
- Multiple visualization modes:
- Time-domain plot
- FFT (Fast Fourier Transform) plot
- Bandpower visualization (time series & bar chart)
- Power Spectrum Density (PSD)
- Spectrogram (time-frequency plot)
- Apply Artifact Subspace Reconstruction (ASR) to remove artifacts from EEG data
- Convert
.csvdata to.bdfand vice-versa - Export processed data to
.csvand.bdf - Multi-file session support
- Export plots of processed data (FFT, bandpower etc.) as images
- Convert binary recordings from Explore devices to
.csvor.bdf - Convert recordings from Explore devices to EEGLab datasets
- Repair Explore Desktop recordings with binary files